Top 10 React Performance Optimization Techniques Every Developer Should Know in 2026
Fix slow React apps with 10 optimization techniques covering code splitting, memoization, React 19 concurrent rendering, virtualization, and Core Web Vitals alignment.

Table of contents
Key Takeaways
- Profile before you optimize using React DevTools and Lighthouse to find the actual bottleneck first.
- Code splitting with `React.lazy()` can cut initial bundle size by 30-50%, directly improving LCP.
- Apply `React.memo`, `useMemo`, and `useCallback` selectively because memoizing everything without measurement adds overhead, not speed.
- React 19's `useTransition` and `useDeferredValue` keep the UI responsive by deferring non-urgent updates during heavy computation.
- Virtualize any list over 100 items because rendering only visible DOM nodes turns multi-second renders into instant ones.
- Match the fix to the symptom: slow load needs code splitting, sluggish interactions need memoization, and janky scrolling needs virtualization.
Your React application was fast when you started building it. The initial prototype loaded instantly, interactions felt crisp, and everything worked the way the documentation promised. Then the product grew. Feature requests stacked up. Third-party libraries accumulated. Now every click carries a perceptible delay, the page takes multiple seconds to render, and your Lighthouse score has dropped into the orange.
I have been through this exact situation on multiple client projects. The good news is that most React performance problems come from a handful of common root causes. The React ecosystem in 2026, with React 19's concurrent rendering, the React Compiler, and Google's shift to Interaction to Next Paint (INP) as a Core Web Vital, provides more tools than ever for building responsive applications. However, these tools only help if you know where and when to apply them.
This guide covers the 10 techniques I use most often when optimizing React apps. Each technique connects directly to measurable outcomes: faster load times, lower Core Web Vitals thresholds, and improved user retention. We will start with the ones that give you the biggest gains with the least effort and work our way to more advanced techniques.
If you're building a React application at scale and need to hire experienced React developers who already understand these patterns, that option is also available.
But first, let's walk through what you can implement today.
Why React Apps Get Slow (Common Causes)
Before applying any optimization, it is worth understanding the mechanisms that cause React applications to degrade in performance. Most issues trace back to three root causes.
The Re-Render Cascade Problem
React's default rendering behavior is aggressive by design. When a parent component's state changes, React re-renders every child in that subtree, regardless of whether their props have actually changed. This cascading behavior is the single most common source of wasted computational work in React applications.
Consider a dashboard with 50 components. If the top-level layout component re-renders because of a theme toggle, all 50 child components re-render, trigger their own virtual DOM diffing operations, and potentially cause expensive DOM mutations. The virtual DOM catches cases where the real DOM doesn't need updating, but the diffing work itself is not free.

See the re-render cascade diagram above. The left side shows how re-renders propagate to every child, while the right side shows how `React.memo` selectively blocks re-renders where props haven't changed.
Large Bundle Size and Initial Load
JavaScript bundles grow incrementally. A utility library added for one feature, a date picker for another, and an animation library for a marketing page; each addition is small in isolation. Over 18 months of active development, a React application's production bundle can easily exceed 500KB, sometimes reaching 1MB or more. Users on mobile networks download all of this JavaScript before they see a single interactive element.
Unoptimized images. Large, uncompressed images block page load, compete with critical resources for bandwidth, and inflate Largest Contentful Paint times.
Expensive calculations running on every render. Sorting, filtering, or transforming large datasets inside a component body executes on every re-render, even when the underlying data hasn't changed.
How Performance Connects to Core Web Vitals and Business Outcomes
React performance is not an abstract technical metric. Google evaluates your site against three specific Core Web Vitals thresholds that directly influence search rankings and user behavior:
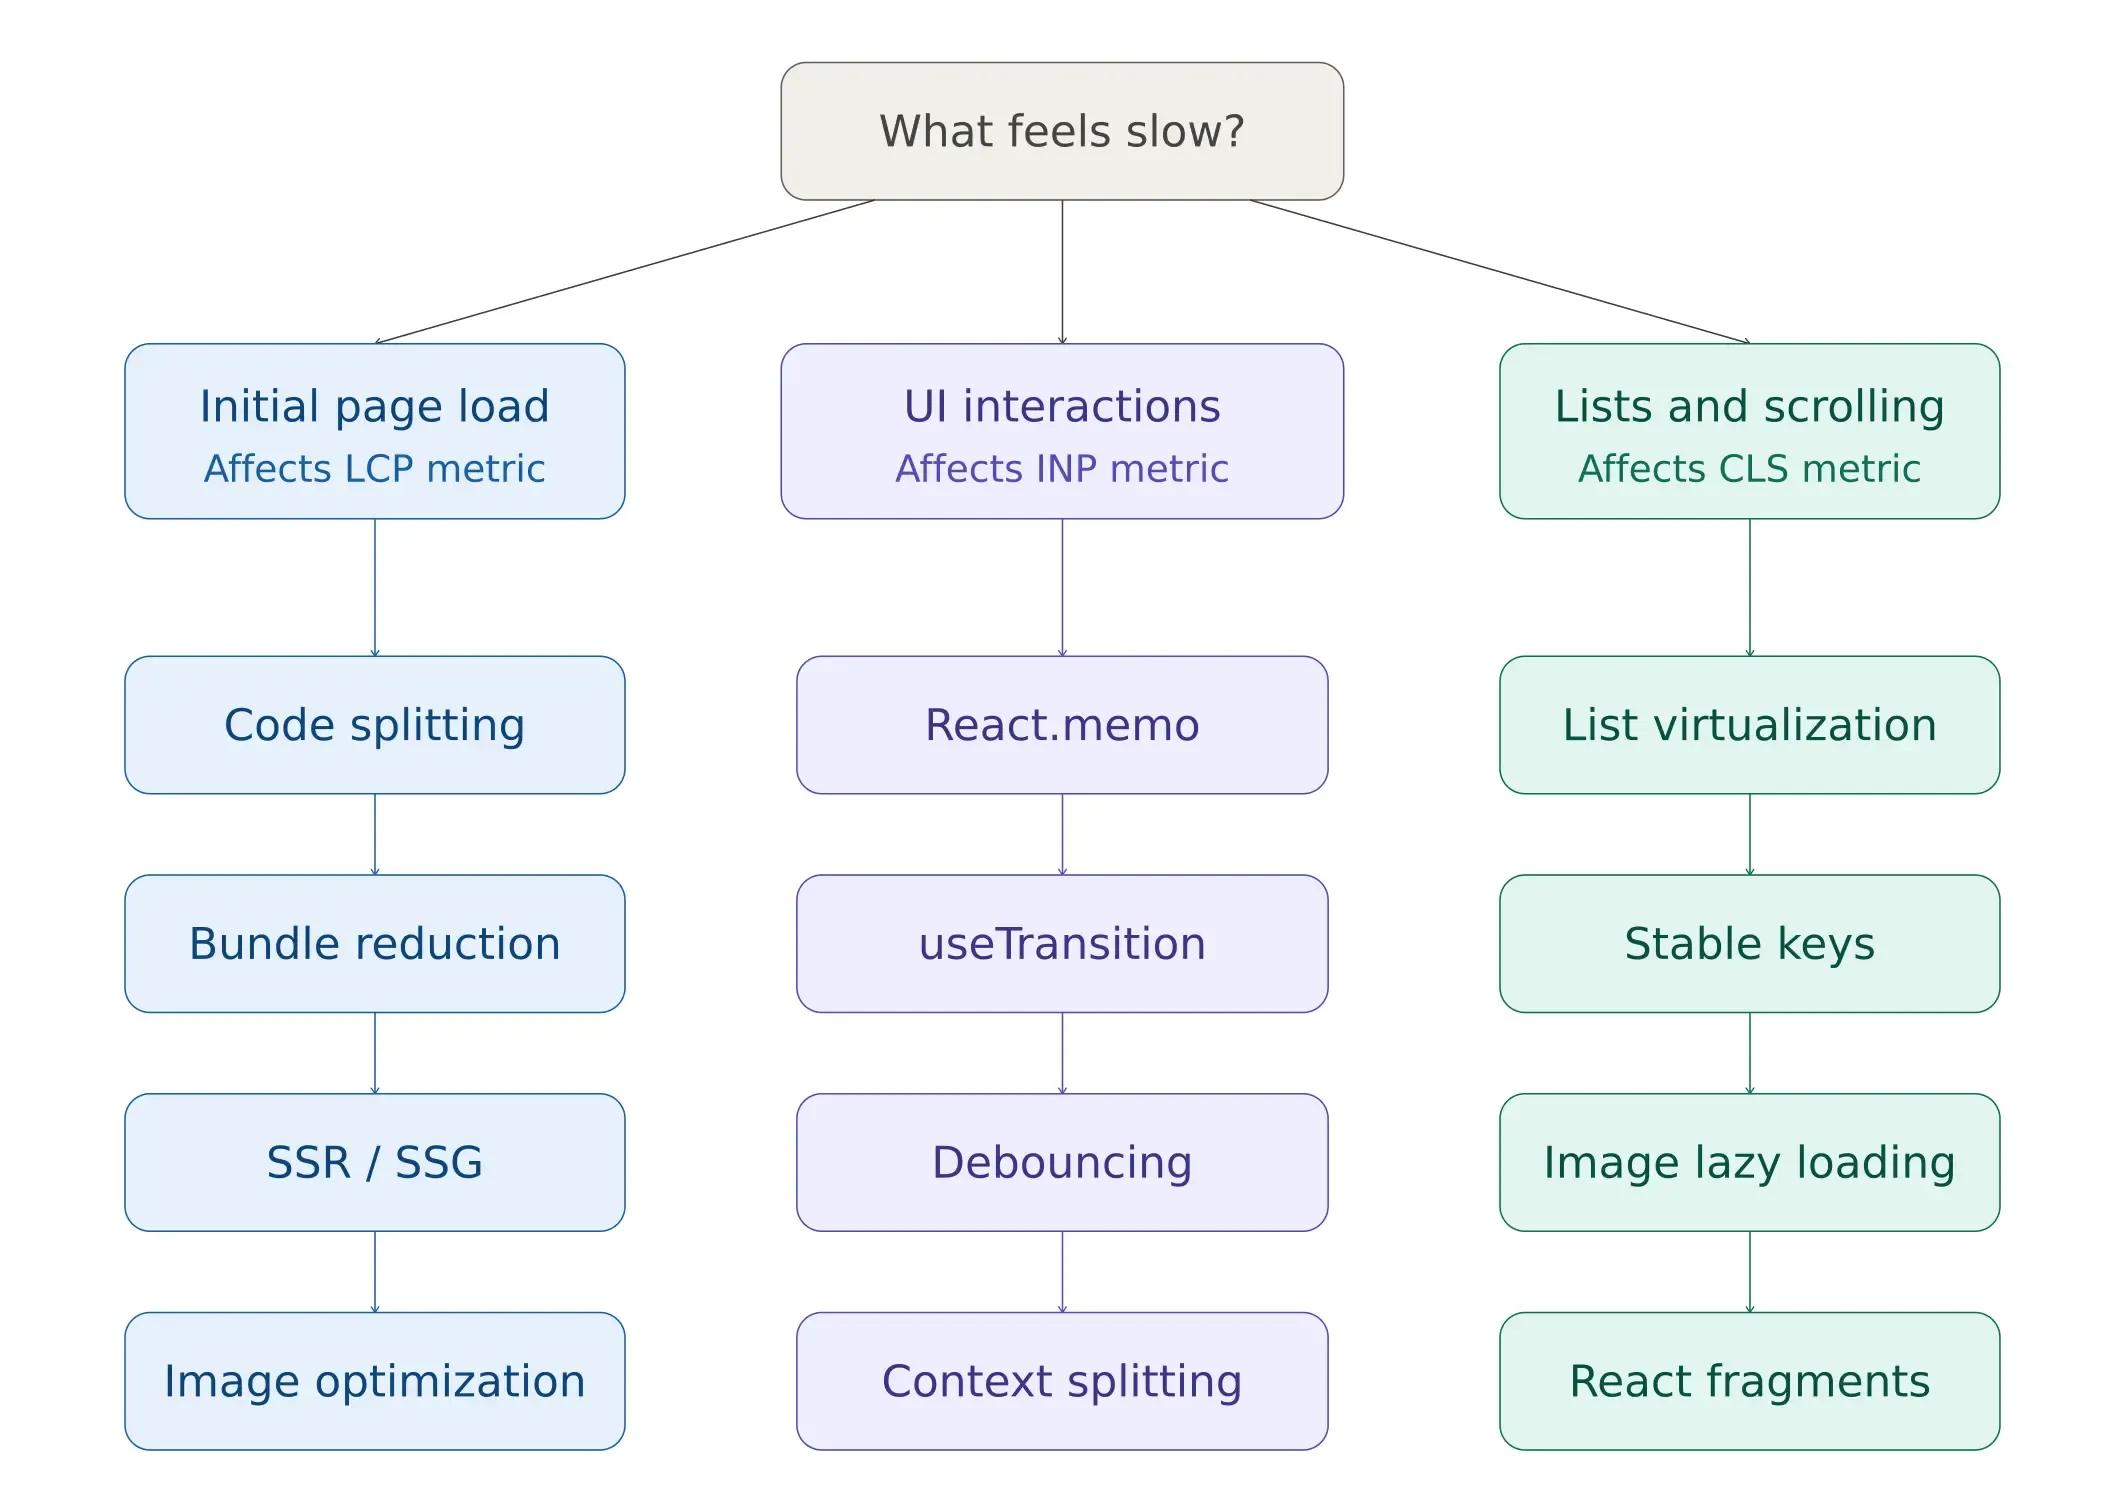
Largest Contentful Paint (LCP) measures how quickly the main content element becomes visible. The target is under 2.5 seconds. Code splitting, image optimization, and server-side rendering directly reduce LCP.
Interaction to Next Paint (INP) replaced First Input Delay in March 2024 and measures how quickly your application responds to user interactions throughout the entire page session. The threshold is 200 milliseconds. Memoization, debouncing, concurrent rendering features, and virtualization all contribute to lower INP scores.
Cumulative Layout Shift (CLS) measures visual stability, or whether content jumps around as the page loads. The target is below 0.1. Explicit image dimensions, lazy loading strategies, and React fragments help minimize layout shift.

See the Core Web Vitals technique mapping diagram above; it maps each optimization technique to the specific metrics it improves.
The business impact is direct. Research from major platforms indicates that each 100 milliseconds of latency can measurably reduce conversion rates. Sites passing all three Core Web Vitals thresholds see measurably better organic performance and lower bounce rates compared to failing competitors.
Measure Before You Optimize: Profiling Your React App
One of the most consequential mistakes in React performance work is optimizing based on intuition rather than data. Before changing any code, measure what is actually slow.
React DevTools Profiler
The React DevTools Profiler is the most direct tool for identifying rendering bottlenecks. It shows exactly which components re-rendered during an interaction, how long each render took, and what triggered the render, whether it was a prop change, a state update, or a context shift.
Open Chrome DevTools, navigate to the Profiler tab in the React DevTools extension, click Record, perform the interaction that feels slow, and stop recording. The flamegraph view immediately surfaces the most expensive components. Focus on components that render frequently and take long to render, as these are the highest-impact optimization targets.
Lighthouse and Web Vitals Monitoring
Lighthouse, available in Chrome DevTools, provides a comprehensive performance audit including specific recommendations for each Core Web Vital. For production applications, integrate the web-vitals JavaScript library to collect real-user data, as lab measurements don't always reflect actual user experiences across different devices and network conditions.
The profiling workflow follows a consistent pattern: run Lighthouse to identify which Core Web Vital needs work, use the React DevTools Profiler to isolate the slowest components, apply the appropriate technique from this guide, and re-measure to confirm the improvement.
Now, let us fix each of these.
1: Code Splitting with React.lazy()
By default, your build tooling bundles the entire React application into one or a small number of JavaScript files. Users have to download all of that code before the application becomes interactive, even if they only visit one page.
Code splitting breaks the application into smaller chunks that load on demand. `React.lazy()` combined with `Suspense` makes route-level splitting easy:
import { lazy, Suspense } from 'react';
// Instead of static import:
// import Dashboard from './Dashboard';
// Do this:
// Dynamic import - Dashboard loads only when rendered:
const Dashboard = lazy(() => import('./Dashboard'));
function App() {
return (
   <Suspense fallback={<div>Loading...</div>}>
     <Dashboard />
   </Suspense>
);
}
Now, the Dashboard component loads only when it is actually rendered. For larger apps, route-level code splitting can cut the initial bundle size by 30-50%. This leads to faster LCP scores.
The highest-impact splitting point is at the route level; each page becomes its own chunk. Beyond routes, consider splitting heavy third-party libraries (chart libraries, rich text editors, PDF viewers) that are only used on specific pages. For a detailed technical walkthrough, see the React documentation on code splitting.
Teams working on complex frontend architectures often benefit from developers who have implemented code splitting in production environments. If your React development roadmap prioritizes performance, establishing splitting conventions early prevents bundle bloat.
2: Memoization (React.memo, useMemo, useCallback)
React re-renders a component every time its parent re-renders, even when the component's props have not changed. React.memo wraps a component and performs a shallow prop comparison before committing to a re-render. If props haven't changed, the render is skipped entirely.
Look at the code snippets below:
const ExpensiveList = React.memo(function ExpensiveList({ items }) {
// This only re-renders when 'items' reference changes
return (
   <ul>
     {items.map(item => <li key={item.id}>{item.name}</li>)}
   </ul>
);
});
React.memo is the first line of defense, but it is only effective when combined with stable prop references. This is where useMemo and useCallback become relevant:
function ProductPage({ products }) { // Only recalculate when products reference changes const sortedProducts = useMemo(() => { return [...products].sort((a, b) => b.price - a.price); }, [products]);// Stable function reference across renders const handleDelete = useCallback((id) => { // delete logic }, []);
return <ExpensiveList items={sortedProducts} onDelete={handleDelete} />; }
When Not to Memoize
Memoization is not a universal solution; it has its own cost. Every React.memo wrapper adds a shallow comparison check on every render. Every useMemo and useCallback stores an additional value in memory and runs a dependency comparison. For lightweight components that render quickly, the overhead of memoization can exceed the cost of simply re-rendering.
The decision framework is simple: profile first with React DevTools, identify components that re-render frequently with measurable render times (above 5-10ms), and apply memoization selectively to those components. Wrapping every component in React.memo without measurement is a common anti-pattern that adds complexity without measurable benefit.
How Do React 19 Concurrent Features Improve Performance?
React 19 introduced concurrent rendering features that fundamentally change how developers manage responsiveness. Two hooks, useTransition and useDeferredValue, allow you to separate urgent updates (typing, clicking) from non-urgent updates (filtering large lists, recalculating charts), ensuring the UI stays responsive even during computationally expensive operations.
useTransition for Non-Blocking State Updates
useTransition marks specific state updates as low-priority. React processes urgent interactions first and defers the wrapped update until the main thread is free. This is particularly effective for search-as-you-type patterns and tab switching in data-heavy applications.
import { useState, useTransition } from 'react';
function ProductSearch({ products }) {
const [query, setQuery] = useState('');
const [filtered, setFiltered] = useState(products);
const [isPending, startTransition] = useTransition();
const handleChange = (e) => {
   const value = e.target.value;
   setQuery(value); // Urgent - update input immediately
   startTransition(() => {
     // Non-urgent - filter can wait
     const results = products.filter(p =>
       p.name.toLowerCase().includes(value.toLowerCase())
     );
     setFiltered(results);
   });
};
return (
   <div>
     <input value={query} onChange={handleChange} />
     {isPending && <p>Filtering...</p>}
     <ProductList items={filtered} />
   </div>
);
}
The isPending flag provides immediate visual feedback while the heavy filtering operation runs in the background. The input field remains responsive on every keystroke; the user never experiences the input lag that would otherwise occur when filtering thousands of items.
For a complete API reference, see the React useTransition documentation.
useDeferredValue for Expensive Renders
Where useTransition wraps the state update, useDeferredValue wraps the value itself. It is the better choice when you don't have direct access to the state-setting code, for example, when a value arrives via props from a parent component.
import { useDeferredValue, useMemo } from 'react';
function SearchResults({ query, items }) {
const deferredQuery = useDeferredValue(query);
const filtered = useMemo(() => {
   return items.filter(item =>
     item.name.toLowerCase().includes(deferredQuery.toLowerCase())
   );
}, [deferredQuery, items]);
return <List items={filtered} />;
}
React keeps showing the previous results until the new filtered list is ready, preventing the UI from freezing during the computation. Combined with useMemo, this pattern handles lists of 10,000+ items without perceptible lag.
When to Use Which
The difference is in the architecture. Use useTransition when you control the state update; you can wrap setState in startTransition. Use useDeferredValue when the value comes from outside your control (props, external stores), and you want to defer how it's consumed in rendering. Both improve INP scores by keeping the main thread available for urgent user interactions.
These hooks won't speed up your code. Instead, they help your app feel faster. They achieve this by ensuring heavy computation doesn’t interrupt immediate user feedback. For applications where this distinction is important at scale, having expert React developers who understand concurrent rendering patterns is a significant advantage.
3: Virtualization for Long Lists
If you are rendering a list with hundreds or thousands of items, the browser creates a DOM node for each one. This directly impacts both initial render time and interaction responsiveness, as the browser must layout, paint, and manage event listeners for every element, even those far outside the visible viewport.
Virtualization solves this by rendering only the items currently visible on screen, plus a small buffer above and below. The react-window library is the most widely adopted solution:
import { FixedSizeList } from 'react-window';
function VirtualizedList({ items }) {
return (
   <FixedSizeList
     height={400}
     itemCount={items.length}
     itemSize={50}
     width={300}
   >
     {({ index, style }) => (
       <div style={style}>{items[index].name}</div>
     )}
   </FixedSizeList>
);
}
For a list of 10,000 items, virtualization renders only about 20 DOM nodes at any given time, rather than 10,000. I have seen this single change take a list from taking 3 seconds to render in an instant. If you have more than 100 items, consider virtualization. Below that count, the DOM handles the list without noticeable performance degradation. Above it, the gains from virtualization compound as the number of items increases.
For more details, see the react-window package.
4: Image Optimization and Lazy Loading
Images are usually the biggest files on a page of most React applications. Here are three optimization methods to quick win:
Use Modern Formats. New formats reduce file size without visible loss of quality. WebP images are 25-35% smaller than JPEGs at the same quality, and most browsers now support them. AVIF, where browser support allows, offers even greater compression. Converting your image pipeline to serve modern formats directly improves LCP.
<img src="photo.webp" alt="Description" />Lazy Load Images. Native lazy loading defers offscreen images. The loading="lazy" attribute tells the browser to hold off loading images until they scroll into view. It reduces initial page weight and prevents images from competing with critical resources.
Only load images when they scroll into view:
<img src="photo.webp" loading="lazy" alt="Description" />Use Responsive Images. Responsive images serve appropriate sizes for each viewport. Sending a 2000px-wide image to a 400px mobile screen wastes bandwidth and processing time.
Serve different sizes for different screens:
<img
srcSet="photo-400.webp 400w, photo-800.webp 800w"
sizes="(max-width: 600px) 400px, 800px"
src="photo-800.webp"
alt="Description"
/>
For React applications built with Next.js, the next/image component automatically handles format conversion, responsive sizing, and lazy loading. Teams building with Next.js may want to hire Next.js developers who understand the full range of image optimization capabilities the framework provides.
For React-specific image optimization, check out next/image if you are using Next.js.
5: Bundle Size Reduction
A large JavaScript bundle is the most direct cause of slow initial load times. Two practices keep bundle size under control. Here is how to keep it small:
Use Tree Shaking. Tree shaking eliminates unused code. Modern bundlers (Webpack, Vite, Rollup) remove unused exports from your dependencies, but only if you import what you need:
// Bad - Imports the entire library (~70KB)
import _ from 'lodash';
// Good - Imports only the function you need (~2KB)
import debounce from 'lodash/debounce';
This single change can reduce the contribution of a dependency from 70KB to 2KB. Multiply that pattern across 10-15 dependencies, and the cumulative savings are substantial.
Analyze Your Bundle. Bundle analysis identifies the largest contributors. Tools like webpack-bundle-analyzer or the Vite equivalent visualize exactly what occupies space in your production bundle:
npm install -D rollup-plugin-visualizerWith the visualization, you will often find that one or two packages account for a large share of your bundle. Sometimes there is a lighter alternative, and sometimes you can lazy-load it.
6: Debouncing Expensive Operations
If you have a search input that fetches results as the user types, it triggers an API call on every keystroke, which can create dozens of unnecessary requests. Debouncing delays the call until the user stops typing, reducing API load and unnecessary re-renders:
import { useState, useEffect } from 'react';
function SearchInput() {
const [query, setQuery] = useState('');
const [debouncedQuery, setDebouncedQuery] = useState('');
useEffect(() => {
   const timer = setTimeout(() => {
     setDebouncedQuery(query);
   }, 300);
   return () => clearTimeout(timer);
}, [query]);
useEffect(() => {
   if (debouncedQuery) {
     fetchResults(debouncedQuery);
   }
}, [debouncedQuery]);
return <input value={query} onChange={(e) => setQuery(e.target.value)} />;
}
A 300ms debounce window catches most typing pauses. It does this without adding noticeable delay. For scroll-based actions, like infinite scroll triggers and resize handlers, limit them to 100-200ms intervals. This ensures they run frequently instead of waiting for the activity to pause.
The concurrent rendering approach using useTransition provides a React-native alternative for UI updates. It’s a better choice than debouncing. Both methods cut down on extra work. However, useTransition fits better with React's rendering model for deferring at the component level. On the other hand, debouncing is still the best way to lower API call frequency.
7: Avoid Inline Object and Function Creation
Every time a component renders, inline objects and functions create new references in memory. Since React.memo relies on reference equality to determine whether props have changed, inline creation defeats memoization:
// Bad - Creates a new object reference every render; breaks React.memo
<div style={{ color: 'red', fontSize: '16px' }}>Hello</div>
// Good - Stable reference; React.memo works correctly
const styles = { color: 'red', fontSize: '16px' };
<div style={styles}>Hello</div>
The same principle applies to callback functions passed as props. Either define them outside the component body or stabilize them with useCallback when they depend on component state.
When rendering a list of 500 items, replacing inline style objects with stable references eliminates 500 unnecessary object allocations per render cycle. The impact compounds with component depth and render frequency.
8: Use React Fragments to Reduce DOM Nodes
Every unnecessary wrapper <div> added for structural convenience adds to the DOM size. React Fragments render children without introducing extra elements:
// Adds an unnecessary wrapper div
function Item() {
return <div><span>Name</span><span>Price</span></div>;
}
// No extra wrapper
function Item() {
return <><span>Name</span><span>Price</span></>;
}
In isolation, this might seem minor. But in a list of 500 items, that represents 500 unnecessary DOM nodes removed from the tree. Reduced DOM size improves CLS scores, lowers memory usage, and speeds up browser layout and paint operations. The cumulative effect matters most in applications with deep component hierarchies and repeated list patterns.
9: Optimize Context Usage
React Context provides a simple mechanism for sharing global state across components. However, when a context value changes, every component that consumes that context re-renders, even if the specific piece of data it uses hasn't changed.
The solution is to split your contexts by update frequency:
// Bad - Single context for everything. In this case, every consumer re-renders on any change
const AppContext = createContext({ user, theme, language });
// Good - Separate contexts. In this case, only affected consumers re-render.
const UserContext = createContext(user);
const ThemeContext = createContext(theme);
const LanguageContext = createContext(language);
With separate contexts, a theme toggle re-renders only components that consume ThemeContext. Components using UserContext or LanguageContext remain unaffected. In applications with 50+ context consumers, this separation can reduce the total number of re-renders per interaction by an order of magnitude.
For applications with complex state requirements, dedicated state management libraries (Zustand, Jotai, Redux Toolkit) offer built-in selector patterns that provide more specific subscription control than React Context alone.
10: Server-Side Rendering (SSR) and Static Generation
If your application has slow initial load times despite client-side optimization, server-side rendering removes the bottleneck of waiting for JavaScript to download, parse, and execute before any content appears. Next.js makes this even easier for React apps. It supports SSR, static site generation (SSG), and incremental static regeneration (ISR).
SSR, SSG, and ISR with Next.js
Next.js provides three rendering strategies, each suited to different content profiles:
Server-Side Rendering (SSR) generates HTML on each request. The server sends a fully rendered page, so the user sees content immediately while JavaScript hydrates in the background.
// pages/products.js (Next.js Pages Router)
export async function getServerSideProps() {
const products = await fetchProducts();
return { props: { products } };
}
function ProductsPage({ products }) {
return (
   <div>
     {products.map(p => <div key={p.id}>{p.name}</div>)}
   </div>
);
}
Static Site Generation (SSG) is ideal for content-heavy pages. It generates HTML at build time and serves pre-built files directly from a CDN, making it extremely fast. This works best for content that doesn’t change on every request, such as marketing pages, documentation, and blog posts.
Incremental Static Regeneration (ISR) updates static pages at set intervals after deployment, without requiring a full rebuild. It combines the speed of static generation with the flexibility to refresh content when needed.
React Server Components in 2026
React Server Components represent the most significant architectural shift in how React handles rendering. Components marked as server components execute entirely on the server, send only the rendered HTML to the client, and contribute zero bytes to the client-side JavaScript bundle.
For applications where a significant portion of components are read-only data displays (product catalogs, dashboards, content pages), Server Components can reduce client-side JavaScript by 40-60%. This directly lowers INP by reducing the JavaScript the main thread must process during interactions.
Organizations evaluating whether to adopt Next.js and Server Components often benefit from Node.js developers who can architect the backend integration alongside the frontend optimization.
Tools to Measure Performance
You cannot improve what you do not measure. Here are the tools I use regularly:
- React DevTools Profiler: Shows which components render, how long each render takes, and what triggered the re-render. Built into the React DevTools browser extension and available for both Chrome and Firefox.
- Lighthouse: Provides a performance audit with specific, actionable recommendations mapped to each Core Web Vital. Access it from Chrome DevTools or run it in CI to prevent performance regressions from reaching production.
- Web Vitals: Google’s web-vitals library collects real-user Core Web Vitals data in production. It provides field data that lab tools can’t, replicating actual user experiences across different devices, networks, and usage patterns. It measures LCP (Largest Contentful Paint), FID (First Input Delay), and CLS (Cumulative Layout Shift) to evaluate real-world performance.
- Webpack Bundle Analyzer: Visualizes the composition of your production JavaScript bundle. It highlights which dependencies add the most weight.
Need Help Optimizing Your React App?
React performance optimization in 2026 follows a systematic approach. First, use profiling tools to identify the bottleneck. Then, determine which Core Web Vital is affected. Next, apply the technique that addresses the root cause. Finally, verify the improvement with data.
For most applications, certain techniques have the greatest impact. These include code splitting to reduce the initial bundle size. Memoization with stable references to prevent unnecessary re-renders. And concurrent rendering features like useTransition to maintain responsiveness during heavy computation. Also, virtualization, image optimization, and context splitting can fix issues found during profiling.
Performance optimization requires experience. If your React app is slow and you need expert help, Softims has senior React developers who specialize in performance tuning. You can browse available React developers or review our freelance developer rates to find the right fit for your project.
Hire experienced React developers 👉 https://softims.com/hire-react-developers/
Looking to build with this stack?
Hire React Developers →
Hryhorii O.
My name is Hryhorii O. and I have over 6 years of experience in the tech industry. I specialize in the following technologies: React, HTML, XML, node.js, JavaScript, etc.. I hold a degree in Master of Computer Applications (MCA), Bachelor of Engineering (BEng). Some of the notable projects I’ve worked on include: The BAY OF VIKINGS. The team of hotels and recreational complexes, TVOE.SHOP. Internet shop for gifts and hostile goods, MOHIO GAMING .Top revenue-making bookmakers software, Cryptocurrency Exchange, GIN Blockchain Explorer, etc.. I am based in Lviv, Ukraine. I've successfully completed 7 projects while developing at Softaims.
I possess comprehensive technical expertise across the entire solution lifecycle, from user interfaces and information management to system architecture and deployment pipelines. This end-to-end perspective allows me to build solutions that are harmonious and efficient across all functional layers.
I excel at managing technical health and ensuring that every component of the system adheres to the highest standards of performance and security. Working at Softaims, I ensure that integration is seamless and the overall architecture is sound and well-defined.
My commitment is to taking full ownership of project delivery, moving quickly and decisively to resolve issues and deliver high-quality features that meet or exceed the client's commercial objectives.
Leave a Comment
Need help building your team? Let's discuss your project requirements.
Get matched with top-tier developers within 24 hours and start your project with no pressure of long-term commitment.